Note
Simplification of roundabouts#
Analysis using street network can be sensitive to the actual geometry representation. For example, one roundabout can be typically represented as 4 or more nodes, while it is topologically only one. Hence measurements attempting to capture topology (e.g. centrality) or node density will be skewed.
The following code exemplifies a simple process for road network simplification of roundabouts using momepy.roundabout_simplification().
For this example we will fetch some data from OpenStreetMap (using osmnx). However, most other data sources should also work as long as their topology has been corrected and can be stored in a GeoDataFrame.
[1]:
import geopandas as gpd
import matplotlib.pyplot as plt
import osmnx as ox

import momepy as mm
Load data#
Using osmnx download a neighborhood and reproject to its local CRS.
Two things are required to achieve good results: 1. Reproject the network to a projected CRS (in meters) 1. Transform the graph to an undirected graph: - This helps to remove overlapping LineStrings once moving to GeoDataFrame.
[2]:
place = "Chamberi, Madrid"

G = ox.graph_from_place(place, network_type="drive", simplify=True, buffer_dist=200)
G_projected = ox.project_graph(G)

edges = ox.graph_to_gdfs(
    ox.get_undirected(G_projected),  # prevents some (semi)duplicate geometries
    nodes=False,
    edges=True,
    node_geometry=False,
    fill_edge_geometry=True,
)

edges.head(3)
[2]:
| osmid | oneway | name | highway | reversed | length | geometry | from | to | maxspeed | lanes | bridge | access | tunnel | junction | |||
|---|---|---|---|---|---|---|---|---|---|---|---|---|---|---|---|---|---|
| u | v | key | |||||||||||||||
| 21990706 | 21990729 | 0 | 390868364 | True | Calle de Mejía Lequerica | residential | False | 60.664 | LINESTRING (440818.925 4475309.730, 440776.640... | 21990706 | 21990729 | NaN | NaN | NaN | NaN | NaN | NaN |
| 21990729 | 25906107 | 0 | 163743121 | True | Calle de la Beneficencia | residential | False | 65.736 | LINESTRING (440776.640 4475353.246, 440825.335... | 21990729 | 25906107 | NaN | NaN | NaN | NaN | NaN | NaN |
| 3144095503 | 0 | 390868364 | True | Calle de Mejía Lequerica | residential | False | 1.550 | LINESTRING (440776.640 4475353.246, 440775.324... | 21990729 | 3144095503 | NaN | NaN | NaN | NaN | NaN | NaN |
[3]:
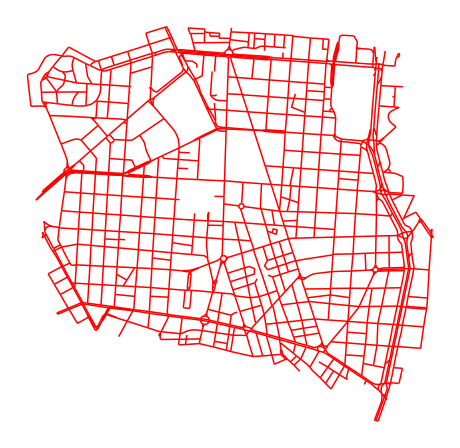
ax = edges.plot(figsize=(8, 12), color="red")
ax.set_axis_off()
Default behavior#
[4]:
edges_output = mm.roundabout_simplification(edges)
/Users/gregoriomaya/mambaforge/envs/test/lib/python3.10/site-packages/pandas/core/dtypes/cast.py:122: ShapelyDeprecationWarning: The array interface is deprecated and will no longer work in Shapely 2.0. Convert the '.coords' to a numpy array instead.
  arr = construct_1d_object_array_from_listlike(values)
[5]:
ax = edges.plot(figsize=(8, 12), color="red")
edges_output.plot(ax=ax, figsize=(8, 12), color="black")

ax.set_axis_off()
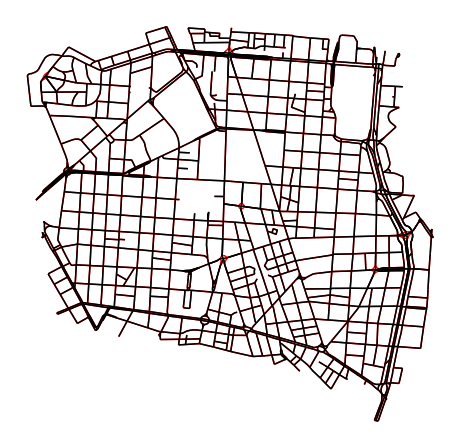
Using the output column 'simplification_group' we can count the number of roundabouts that were simplified:
[6]:
edges_output.simplification_group.nunique()
[6]:
7
In total 7 roundabouts were simplified, and most of their incoming edges were also considered during the process.
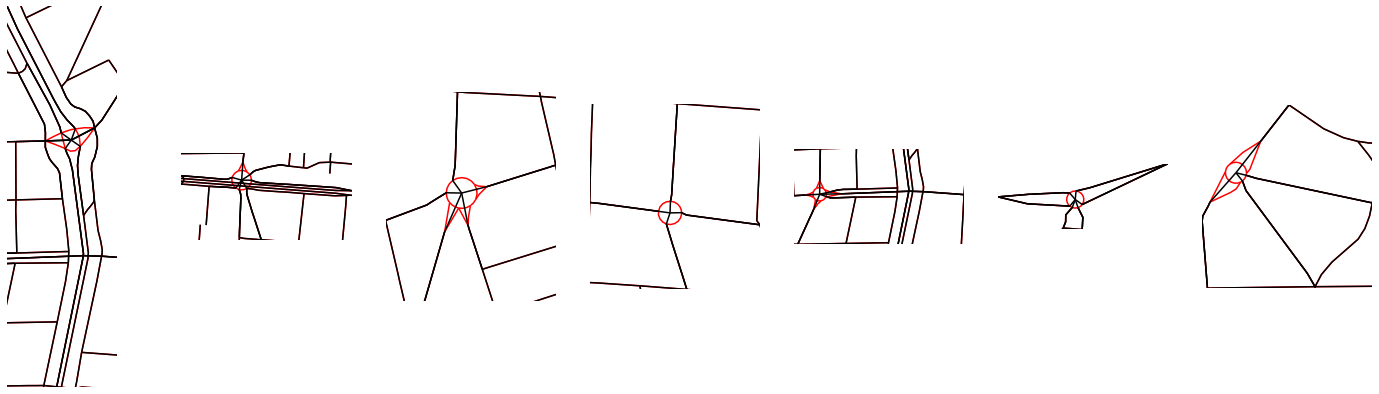
Let’s look at them individually.
[7]:
simplification_groups = edges_output.simplification_group.unique()[1:]

fig, axs = plt.subplots(1, len(simplification_groups), figsize=(25, 7))
axs = axs.flatten()

for i in simplification_groups:
    mask = edges_output.simplification_group == i
    minx, miny, maxx, maxy = edges_output[mask].geometry.total_bounds

    edges.plot(ax=axs[i], color="red")
    edges_output.plot(ax=axs[i], color="black")

    axs[i].set_xlim(minx, maxx)
    axs[i].set_ylim(miny, maxy)
    axs[i].set_axis_off()

plt.show()
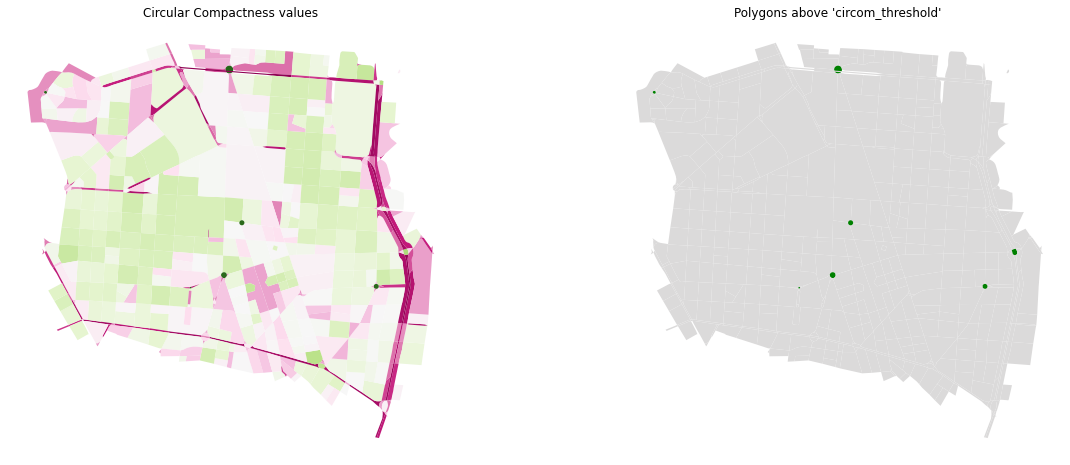
It’s worth investigating why some roundabouts are still missing from simplification. Since the selection of roundabouts is based on the resulting polygons after polygonizing the road network let’s use the circular compactness (measurable as momepy.CircularCompactness) parameter of the resulting polygons as the main selection attribute.
[8]:
from shapely.ops import polygonize

polys = gpd.GeoDataFrame(
    geometry=[g for g in polygonize(edges.geometry)], crs=edges.crs
)
circom_serie = mm.CircularCompactness(polys).series
polys.loc[:, "circom"] = circom_serie
The circom_threshold parameter (default = 0.7) establishes the limit at which roundabouts should be selected.
[9]:
circom_threshold = 0.7
mask = circom_serie > circom_threshold
colors = ["green" if m == True else "#dbdada" for m in mask]

fig, axs = plt.subplots(1, 2, figsize=(20, 8))

polys.plot(ax=axs[0], column="circom", cmap="PiYG")
axs[0].set_axis_off()
axs[0].title.set_text("Circular Compactness values")

polys.plot(ax=axs[1], color=colors)
axs[1].set_axis_off()
axs[1].title.set_text("Polygons above 'circom_threshold' ")
Let’s see the following two false negatives:
[10]:
false_negatives = [[312,314,304], 162]


fig, axs = plt.subplots(1, 2, figsize=(20, 6))


edges.plot(ax= axs[0], color= "black")
polys.plot(ax= axs[0], column="circom", cmap="PiYG")
minx, miny, maxx, maxy = polys.loc[false_negatives[0]].geometry.total_bounds
axs[0].set_xlim(minx-75, maxx+75)
axs[0].set_ylim(miny-75, maxy+75)
axs[0].set_axis_off()
axs[0].title.set_text("Roundabout indexes:\n" + str(false_negatives[0]))

edges.plot(ax= axs[1], color= "black")
polys.plot(ax= axs[1], column="circom", cmap="PiYG")
minx, miny, maxx, maxy = polys.loc[false_negatives[1]].geometry.bounds
label_str = str(round(polys.loc[false_negatives[1]].circom,3))

axs[1].set_xlim(minx-75, maxx+75)
axs[1].set_ylim(miny-75, maxy+75)
axs[1].set_axis_off()
axs[1].title.set_text("Roundabout index: 162\n 'circom': "+ label_str)
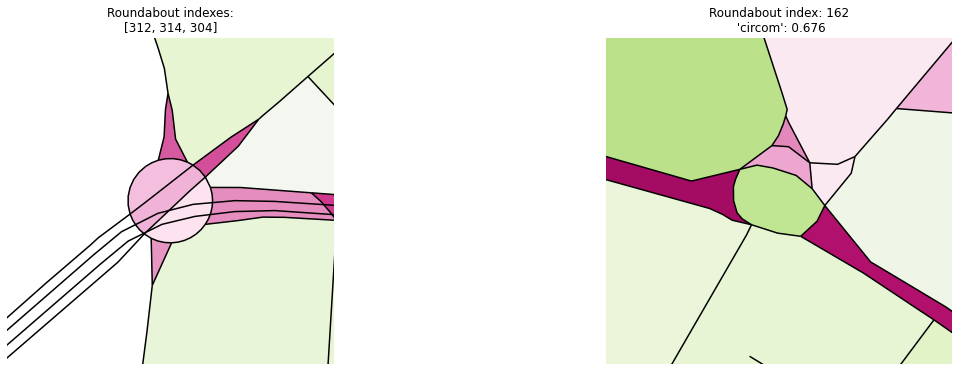
The above helps to exemplify two main reasons why some roundabouts are not being selected: 1. They are crossed by other roads; which breaks them into multiple polygons - eg. index: [314, 312, 304] 1. They don’t meet the circom_threshold - eg. index: [162] –> (0.676)
Adapting parameters#
Finally, let’s also explore what the outcome would look like if we lower the circom_threshold and include_adjacent is set to False
[11]:
edges_output_65 = mm.roundabout_simplification(
    edges, circom_threshold=0.65, include_adjacent=False
)

m = edges.explore(color = "black", tiles = "CartoDB positron")
edges_output.explore(m=m, color="red")
edges_output_65.explore(m=m, color="blue")
m
/Users/gregoriomaya/mambaforge/envs/test/lib/python3.10/site-packages/pandas/core/dtypes/cast.py:122: ShapelyDeprecationWarning: The array interface is deprecated and will no longer work in Shapely 2.0. Convert the '.coords' to a numpy array instead.
  arr = construct_1d_object_array_from_listlike(values)
[11]:
[12]:
edges_output_65.simplification_group.nunique()
[12]:
13
Even though we have been able to simplify 13 supposedly polygons, this sample now contains some false positives. So it is up to the user to decide the right balance to make the most of this simplification.
Note that this is a work in progress and some upcoming enhancements are expected to complement this simplification.