Continuity in street networks
Momepy allows for the deduction of natural continuity of street networks using the COINS algorithm. The street network is split into individual segments and deflection angles between adjacent segments are computed. Segments are then joined to continuous strokes. Segments will only be considered a part of the same stroke if the deflection angle is above the threshold (defaults to zero).
Using a small network
import geopandas as gpd
import momepy
streets = gpd.read_file(momepy.datasets.get_path("bubenec"), layer="streets")
streets.plot(figsize=(10, 10)).set_axis_off()
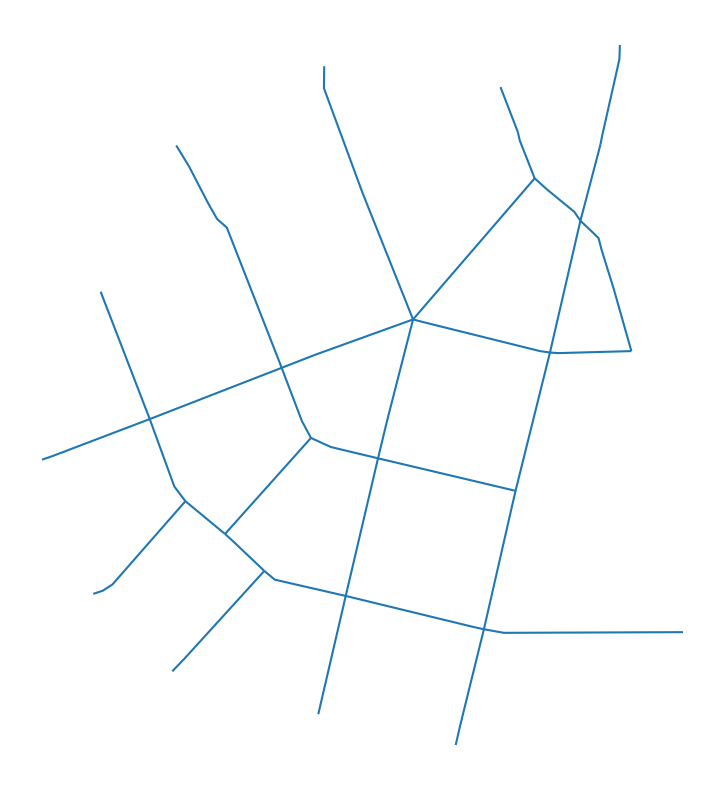
momepy.COINS allows you to create a GeoDataFrame of the final merged strokes or return a Series with a stroke attribute which can be attached to the original geometry.
You first need to compute continuity using the momepy.COINS class.
continuity = momepy.COINS(streets)
Now you can generate required outputs.
stroke_gdf = continuity.stroke_gdf()
stroke_gdf
| n_segments | geometry | |
|---|---|---|
| stroke_group | ||
| 0 | 8 | LINESTRING (1603278.899 6463669.186, 1603283.7... |
| 1 | 19 | LINESTRING (1603077.5 6464475.323, 1603085.515... |
| 2 | 17 | LINESTRING (1603537.194 6464558.112, 1603557.6... |
| 3 | 13 | LINESTRING (1603706.388 6464617.784, 1603705.7... |
| 4 | 5 | LINESTRING (1603413.206 6464228.73, 1603274.45... |
| 5 | 14 | LINESTRING (1602970.377 6464268.058, 1602974.0... |
| 6 | 2 | LINESTRING (1603071.956 6463729.979, 1603089.0... |
| 7 | 3 | LINESTRING (1602959.88 6463839.712, 1602973.36... |
| 8 | 3 | LINESTRING (1603146.696 6463924.63, 1603157.04... |
| 9 | 5 | LINESTRING (1603287.304 6464587.705, 1603286.8... |
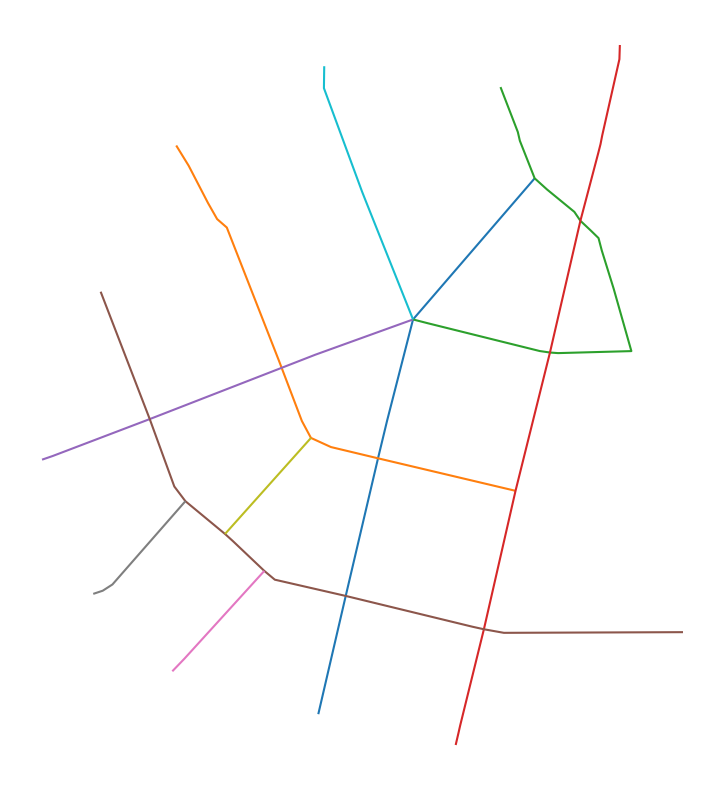
We can plot the data using an unique color per stroke geometry.
stroke_gdf.plot(cmap="tab10", figsize=(10, 10)).set_axis_off()
streets["continuity_stroke"] = continuity.stroke_attribute()
streets.head()
| geometry | continuity_stroke | |
|---|---|---|
| 0 | LINESTRING (1603585.64 6464428.774, 1603413.20... | 0 |
| 1 | LINESTRING (1603268.502 6464060.781, 1603296.8... | 1 |
| 2 | LINESTRING (1603607.303 6464181.853, 1603592.8... | 2 |
| 3 | LINESTRING (1603678.97 6464477.215, 1603675.68... | 3 |
| 4 | LINESTRING (1603537.194 6464558.112, 1603557.6... | 2 |
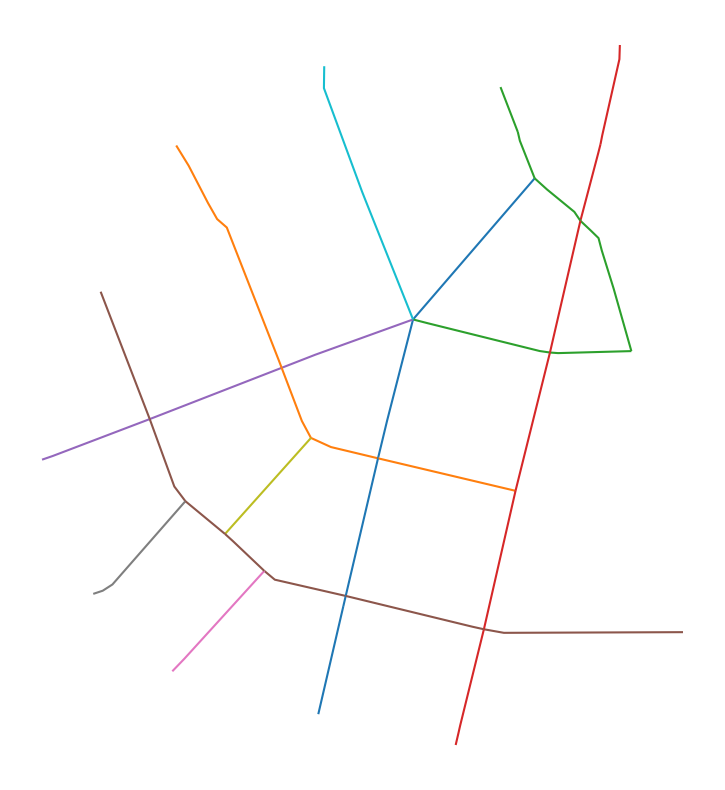
streets.plot(
    "continuity_stroke", categorical=True, figsize=(10, 10)
).set_axis_off()
Using OpenStreetMap data
import osmnx as ox
streets_graph = ox.graph_from_place(
    "Vicenza, Vicenza, Italy", network_type="drive"
)
streets_graph = ox.projection.project_graph(streets_graph)

streets = ox.graph_to_gdfs(
    ox.convert.to_undirected(streets_graph),
    nodes=False,
    edges=True,
    node_geometry=False,
    fill_edge_geometry=True,
)
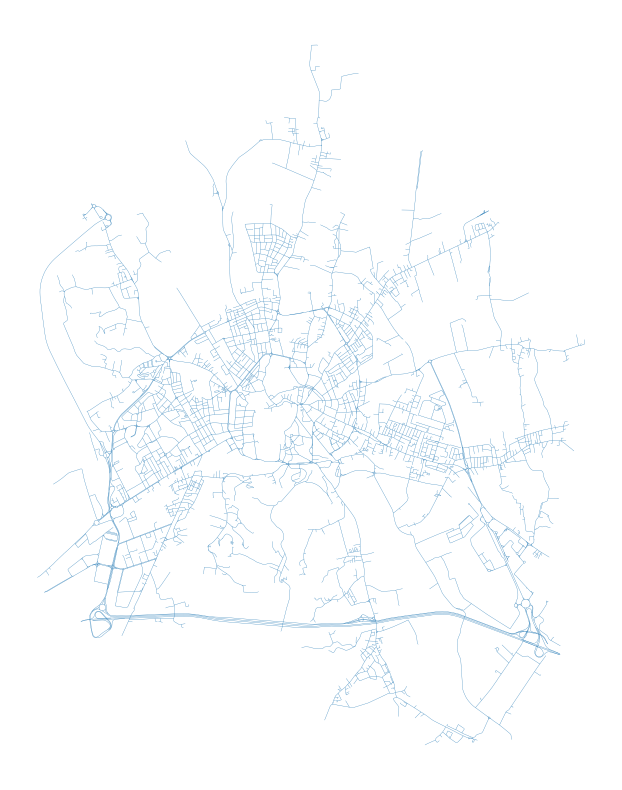
streets.plot(figsize=(10, 10), linewidth=0.2).set_axis_off()
continuity = momepy.COINS(streets)
stroke_gdf = continuity.stroke_gdf()
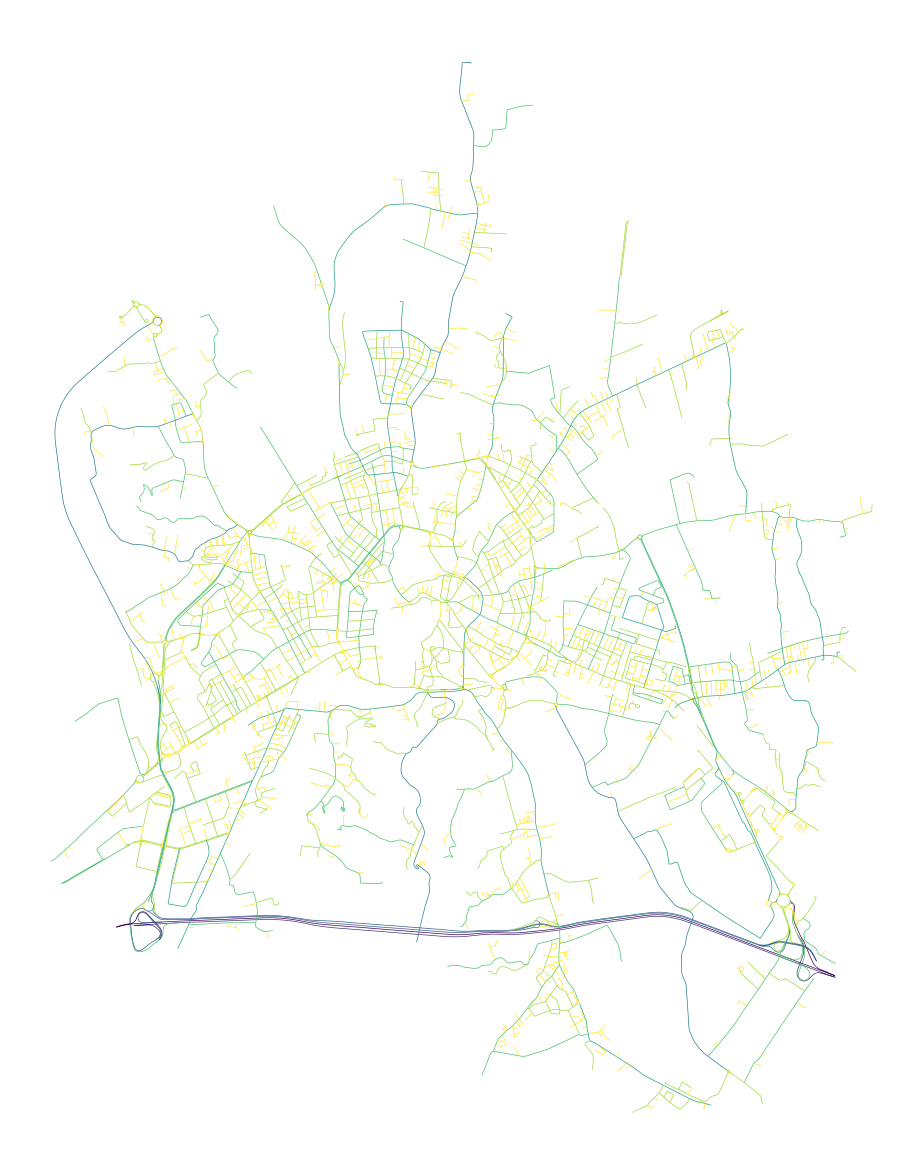
We can look into the continuity-based hierarchy of streets based on their total length.
stroke_gdf.plot(
    stroke_gdf.length,
    figsize=(15, 15),
    cmap="viridis_r",
    linewidth=0.5,
    scheme="headtailbreaks",
).set_axis_off()
For details, see the original paper:
Tripathy, P., Rao, P., Balakrishnan, K., & Malladi, T. (2020). An open-source tool to extract natural continuity and hierarchy of urban street networks. Environment and Planning B: Urban Analytics and City Science. http://dx.doi.org/10.1177/2399808320967680