Note
Measuring density
Measuring density is a typical exercise in urban analytics. momepy allows to measure different types (see API/Intensity); this notebook will outline the main principles.
[1]:
import momepy
import geopandas as gpd
import matplotlib.pyplot as plt
We will again use osmnx to get the data for our example and after preprocessing of building layer will generate tessellation layer.
[2]:
import osmnx as ox

point = (40.731603, -73.977857)
dist = 1000
gdf = ox.geometries.geometries_from_point(point, dist=dist, tags={'building':True})
gdf_projected = ox.projection.project_gdf(gdf)
gdf_projected = gdf_projected[gdf_projected.geom_type.isin(['Polygon', 'MultiPolygon'])]

buildings = momepy.preprocess(gdf_projected, size=30,
                              compactness=True, islands=True)
buildings['uID'] = momepy.unique_id(buildings)
limit = momepy.buffered_limit(buildings)
tessellation = momepy.Tessellation(buildings, unique_id='uID', limit=limit).tessellation
Loop 1 out of 2.
Identifying changes: 100%|██████████| 3200/3200 [00:02<00:00, 1481.66it/s]
Changing geometry: 100%|██████████| 2157/2157 [00:17<00:00, 120.11it/s]
Loop 2 out of 2.
Identifying changes: 100%|██████████| 1459/1459 [00:00<00:00, 2104.02it/s]
Changing geometry: 100%|██████████| 863/863 [00:05<00:00, 171.39it/s]
Inward offset...
Discretization...
9%|▊ | 71/833 [00:00<00:01, 706.33it/s]
Generating input point array...
100%|██████████| 833/833 [00:01<00:00, 587.68it/s]
Generating Voronoi diagram...
Generating GeoDataFrame...
Vertices to Polygons: 100%|██████████| 356220/356220 [00:06<00:00, 51892.45it/s]
Dissolving Voronoi polygons...
100%|██████████| 3/3 [00:00<00:00, 716.73it/s]
Preparing limit for edge resolving...
Building R-tree...
Identifying edge cells...
Cutting...
[3]:
f, ax = plt.subplots(figsize=(10, 10))
tessellation.plot(ax=ax)
buildings.plot(ax=ax, color='white', alpha=.5)
ax.set_axis_off()
plt.show()
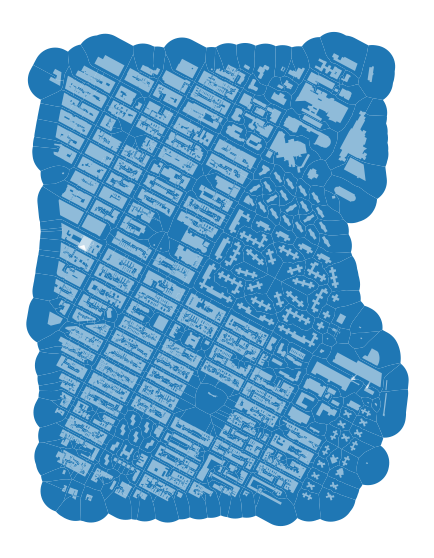
We have some edge effect here as we are using the buffer as a limit for tessellation in the middle of the urban fabric, but for these examples, we can work with it anyway. Keep in mind that values on the edge of this area will be skewed.
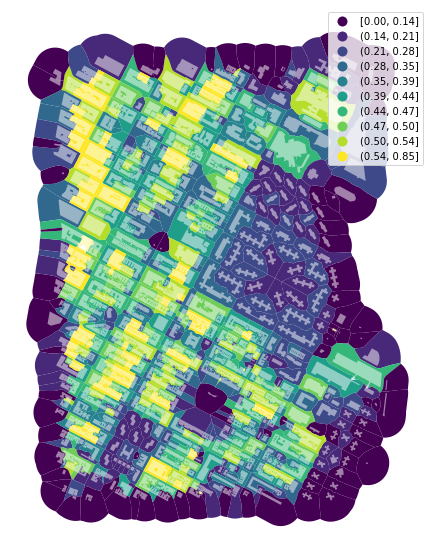
Covered Area Ratio
Covered area ratio, in our case measured on tessellation cells, requires GeoDataFrame containing spatial unit (cell, plot), and GeoDataFrame containing covering objects (buildings). On top of that, it currently requires passed areas for both gdfs and unique ID which links together spatial units and objects on them. We can either calculate areas before:
[4]:
tessellation['area'] = momepy.Area(tessellation).series
buildings['area'] = momepy.Area(buildings).series
tess_car = momepy.AreaRatio(tessellation, buildings, 'area', 'area', 'uID')
tessellation['CAR'] = tess_car.series
Or we can pass momepy.Area().series directly:
[5]:
tess_car = momepy.AreaRatio(tessellation, buildings,
                            momepy.Area(tessellation).series,
                            momepy.Area(buildings).series, 'uID')
tessellation['CAR'] = tess_car.series
[6]:
f, ax = plt.subplots(figsize=(10, 10))
tessellation.plot(ax=ax, column='CAR', legend=True, scheme='quantiles', k=10, cmap='viridis')
buildings.plot(ax=ax, color='white', alpha=0.5)
ax.set_axis_off()
plt.show()
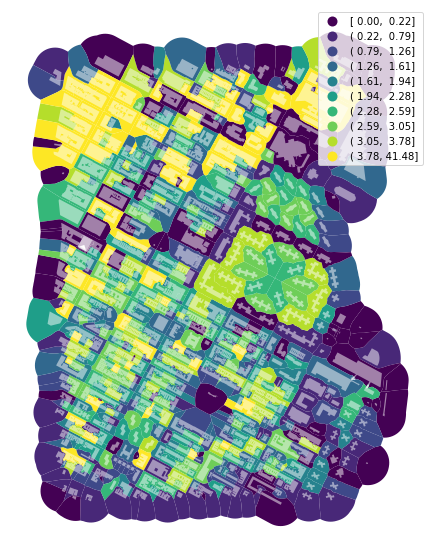
Floor Area Ratio
Because we know building heights for our buildings gdf, we can also calculate FAR. This part of New York has height data, only stored as strings, so we have to convert them to floats (or int) and fill NaN values with zero.
FAR requires floor areas for building gdf instead of covered area.
[7]:
def clean_heights(x):
    try:
        return float(x)
    except ValueError:
        return 0

buildings['height'] = buildings['height'].fillna(0).apply(clean_heights)

buildings['floor_area'] = momepy.FloorArea(buildings, 'height').series
[8]:
tessellation['FAR'] = momepy.AreaRatio(tessellation, buildings,
                                       'area', 'floor_area', 'uID').series
[9]:
f, ax = plt.subplots(figsize=(10, 10))
tessellation.plot(ax=ax, column='FAR', legend=True, scheme='quantiles', k=10, cmap='viridis')
buildings.plot(ax=ax, color='white', alpha=0.5)
ax.set_axis_off()
plt.show()
Location-based density is described in examples using spatial weights.